
Some details of quantitative study
First What is quantitative research?
E.g. Banhari (2021) defines that: "Quantitative research is the process of collecting and analyzing numerical data. It can be used to find patterns and averages, make predictions, test causal relationships, and generalize results to wider populations." (Banhari, P. 2021. An introduction to quantitative research?)
Key Elements of a Research Proposal Quantitative Design (6.9.2021)

Lorsung, Deb. Steps in Quantitative Research. (13.9.2021).
Four main Types of Quantitative Design are:
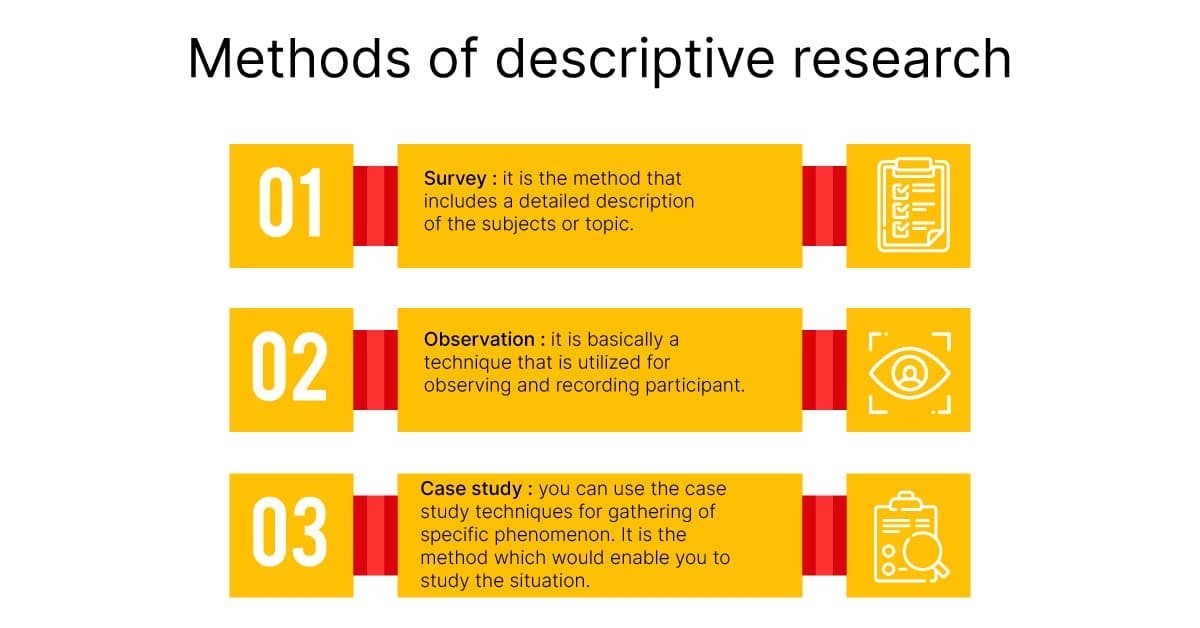
Descriptive research - seeks to describe the current status of an identified variable.
What is a descriptive research? It says that descriptive research does not fit neatly into the definition of either quantitative or qualitative research methodologies, but instead it can utilize elements of both, often within the same study. The term descriptive research refers to the type of research question, design, and data analysis that will be applied to a given topic. Descriptive statistics tell what is, while inferential statistics try to determine cause and effect. (6.9.2021)
What is descriptive research? (6.9.2021).
McCombes, S. (2019). Descriptive research. Scribbr. (6.9.2021).
Correlational research - attempts to determine the extent of a relationship between two or more variables using statistical data.
Causal-comparative/quasi-experimental research - attempts to establish cause-effect relationships among the variables.
Experimental research - often called true experimentation, uses the scientific method to establish the cause-effect relationship among a group of variables that make up a study.
Key Elements of a Research Proposal Quantitative Design (6.9.2021).
Source Descriptive Research (6.9.2021).
 Source: Qualitative and Descriptive Research. (6.9.2021).
Source: Qualitative and Descriptive Research. (6.9.2021).
Quantitative methods
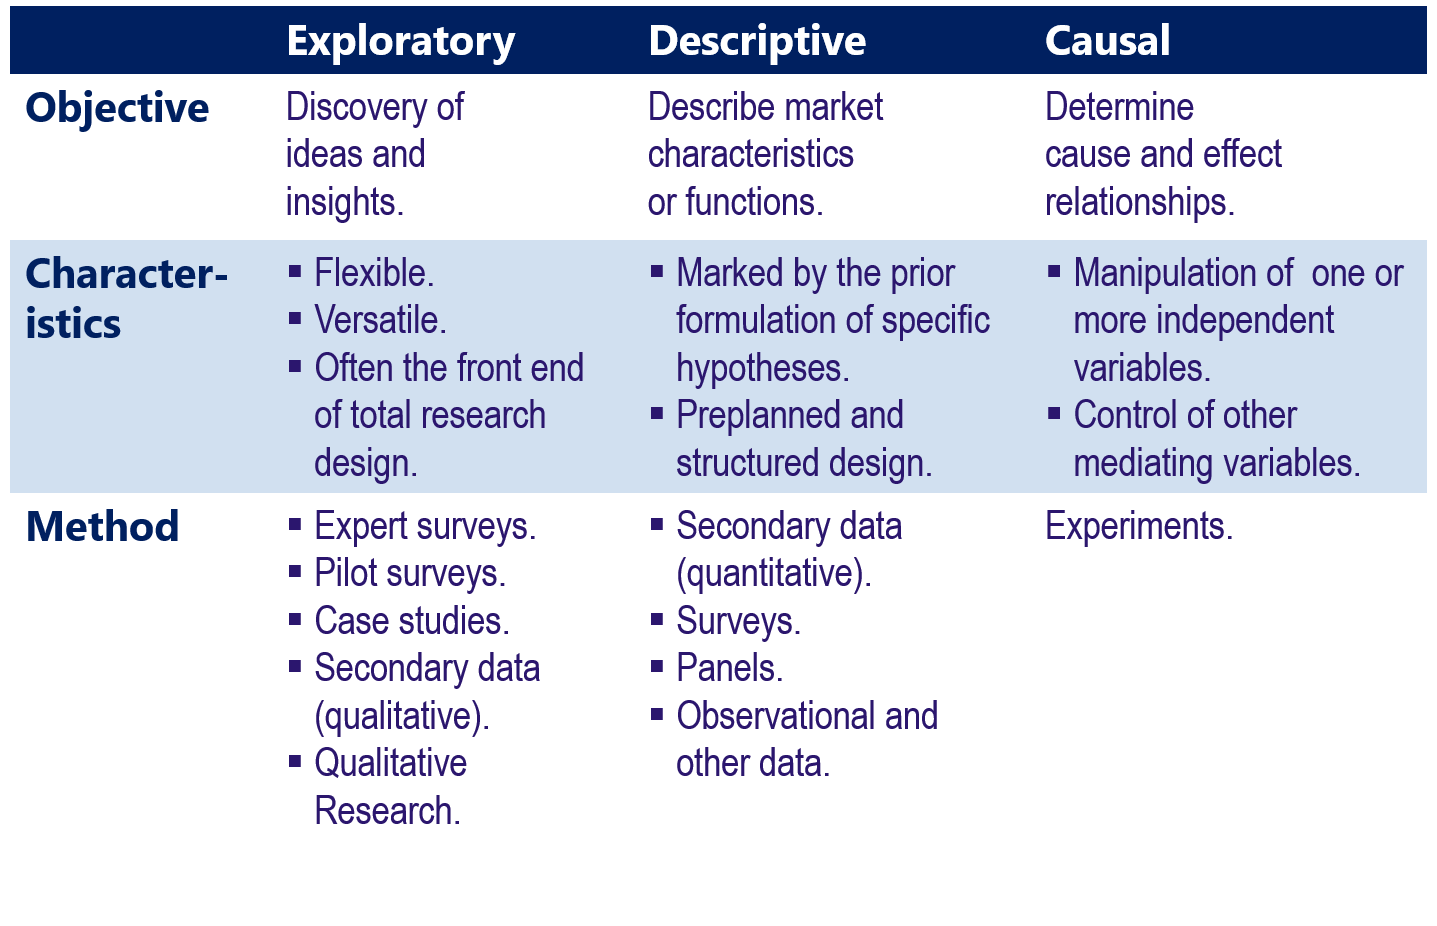
Source Business Research Design (6.9.2021). Excellent example articles!
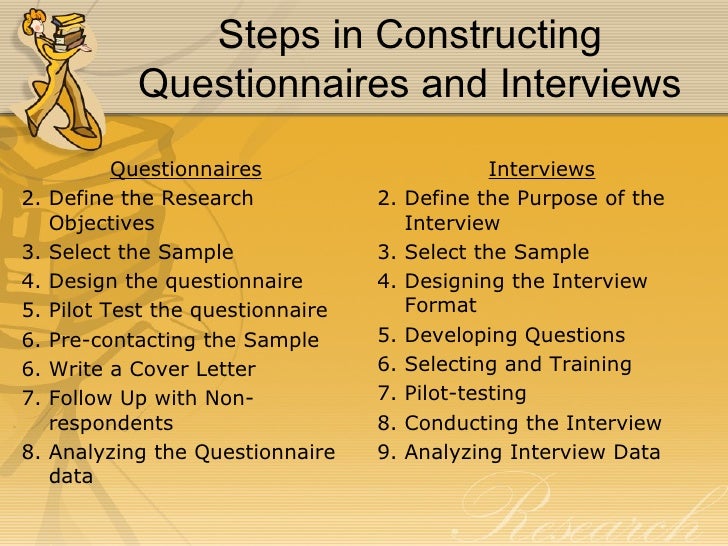
Before you can get sartet analyse your data you have to collect it. you will need a research questionnaire to provide material to help you solve your research problem.
Note that the research form is based on the definitions of the research problem and the sub - problems derived from it, and thus, the form is based on the key concepts and key terms of the research. Background variables must also be defined (background factors that may affect research issues (e.g. gender, education, age). The population is often divided into fractions or quotas for background variables and the sample must contain an adequate representation of each stratum The researcher should have some preconception about the background variables that may be affected in the opinions of the respondents (eg “age may affect the opinion of the respondent”).
Tutkimuksen kyselylomake. (10.9.2021.)

Tutkimuksen kyselylomake. (10.9.2021.)
Data Analysis

Data and Scales
We collect data when conducting quantitative research (Brace, Kemp & Snelgar 2003, 4).
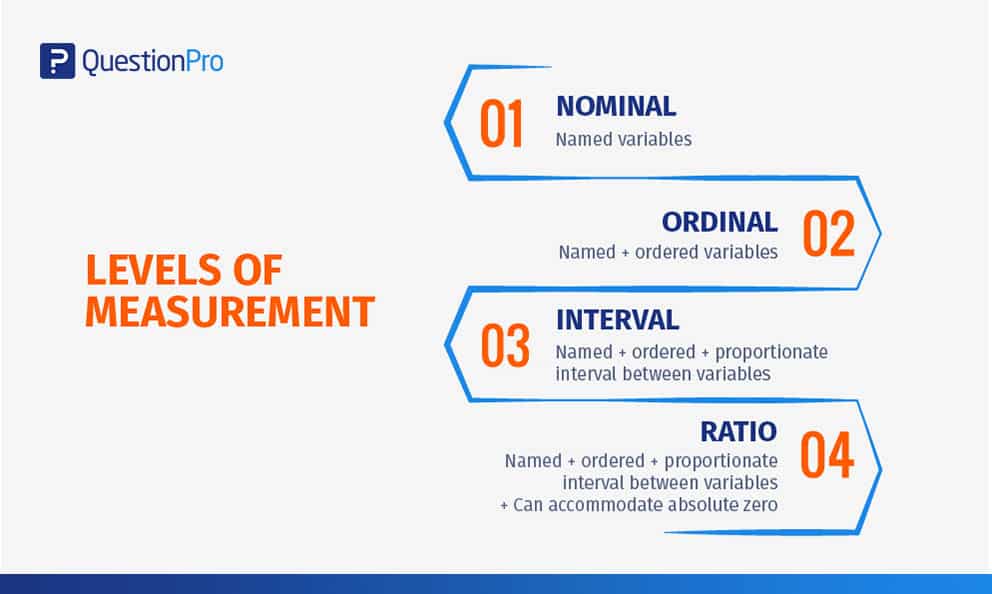
Source Nominal, Ordinal, Interval, Ratio Scales with Examples (9.9.2021).
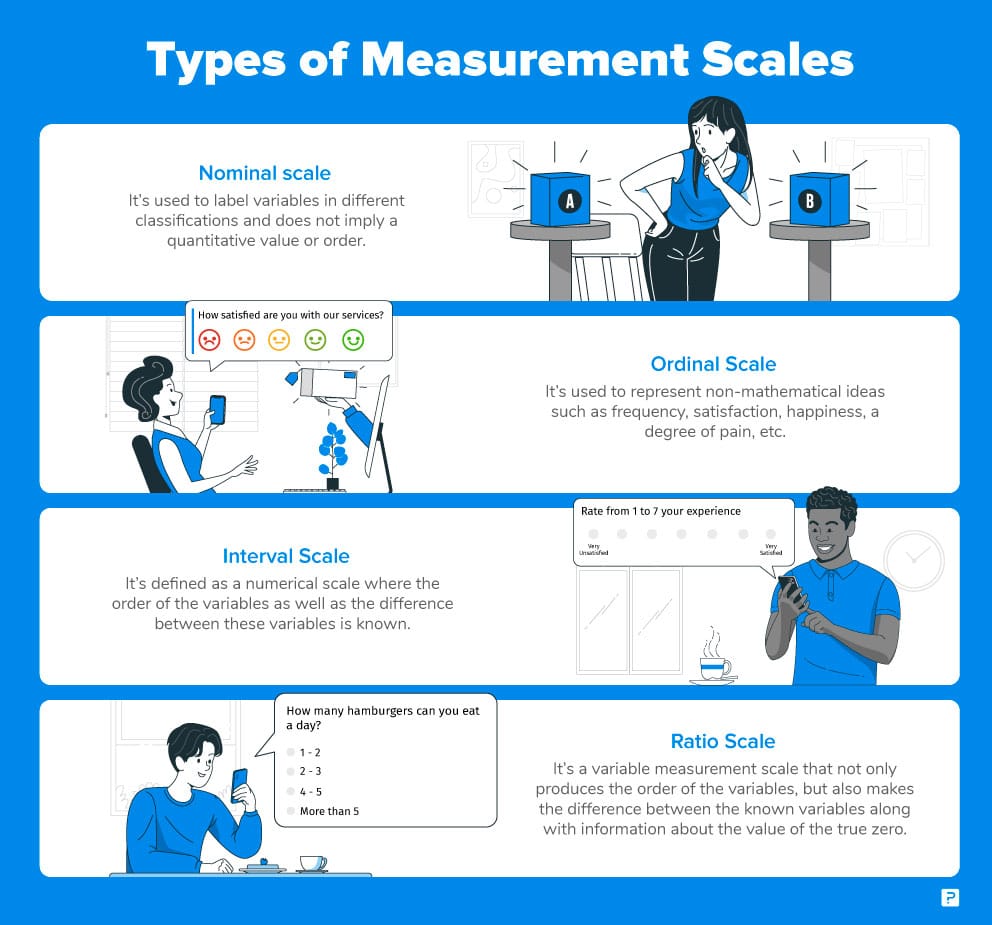
Source Nominal, Ordinal, Interval, Ratio Scales with Examples (9.9.2021).

Source: Types of Data & Measurement Scales: Nominal, Ordinal, Interval and Ratio. (9.9.2021).
Randomization
"In a randomized experiment, a study sample is divided into one group that will receive the intervention being studied (the treatment group) and another group that will not receive the intervention (the control group)." Why to randomize? University of Yale. (9.9.2021).
Suresh, K.P. 2011. An overview of randomization techniques: An unbiased assessment of outcome in clinical research. J Hum Reprod Sci. 2011 Jan-Apr; 4(1): 8–11.doi: 10.4103/0974-1208.82352.
Test of nominal data
2*2 Chi-square Test. (9.9.2021).
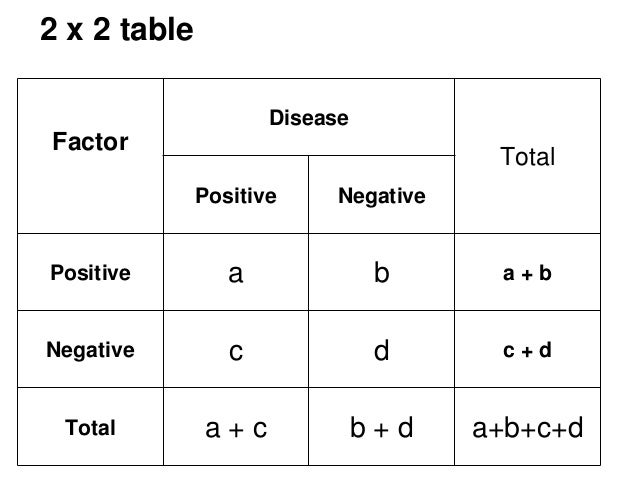
Source: https://www.slideshare.net/bdwjayamanne/md-paediatricts-part-2-epidemiology-and-statistics. (9.9.2021).
Video FI 2 by 2 Table - Step by Step Example (part 1) (9.9.2021)
 Source: One Sample T-test. (9.9.2021).

More


Double Difference
Instrumental Variable Estimation
Regression Discontinuity and Pipeline Methods
Measuring Dstributional Program Effects
Using Economic Models to Evaluate Policies
Randomized Impact Evaluation
Prospensity Score Matching Techique
Duble-Difference Method
Instrumental Variable Method
Regression Discontinuity Design
References and Readings
+10 quantitative research examples. (13.10.2021).
Finnish Social Sience Data Archives Research Methods Guidebook. (10.9.2021). "The Guidebook is an open learning environment accessible to all. It is available in Finnish, providing Finnish students an opportunity to study quantitative and qualitative methods in their own language."
Glossary of Statistical Terms. (13.9.2021). Hudge: 863 terms.
Lerche, I. Basin Analysis Quantitative Methods. Academic Press. Inc. (Google Books, 9.9.2021.)
Osborne, J. W. (Edited). Best Practices in Quantitative Methods. (Google Books, 9.9.2021.)
Tilastoapu. Akin menetelmäblogi. In Finnish only. (10.9.2021).
Algina, J., & Keselman, H. J. (1999). Comparing squared multiple correlation coefficients: Examination of a confidence interval and a test significance. Psychological Methods, 4(1), 76-83.
Bobko, P. (2001). Correlation and regression: Applications for industrial organizational psychology and management (2nd ed.). Thousand Oaks, CA: Sage Publications. View
Bonett, D. G. (2008). Meta-analytic interval estimation for bivariate correlations. Psychological Methods, 13(3), 173-181.
Chen, P. Y., & Popovich, P. M. (2002). Correlation: Parametric and nonparametric measures. Thousand Oaks, CA: Sage Publications. View
Cheung, M. W. -L., & Chan, W. (2004). Testing dependent correlation coefficients via structural equation modeling. Organizational Research Methods, 7(2), 206-223.
Coffman, D. L., Maydeu-Olivares, A., Arnau, J. (2008). Asymptotic distribution free interval estimation: For an intraclass correlation coefficient with applications to longitudinal data. Methodology, 4(1), 4-9.
Cohen, J., Cohen, P., West, S. G., & Aiken, L. S. (2003). Applied multiple regression/correlation analysis for the behavioral sciences. (3rd ed.). Mahwah, NJ: Lawrence Erlbaum Associates. View
Hatch, J. P., Hearne, E. M., & Clark, G. M. (1982). A method of testing for serial correlation in univariate repeated-measures analysis of variance. Behavior Research Methods & Instrumentation, 14(5), 497-498.
Kendall, M. G., & Gibbons, J. D. (1990). Rank Correlation Methods (5th ed.). London: Edward Arnold. View
Krijnen, W. P. (2004). Positive loadings and factor correlations from positive covariance matrices. Psychometrika, 69(4), 655-660.
Shieh, G. (2006). Exact interval estimation, power calculation, and sample size determination in normal correlation analysis. Psychometrika, 71(3), 529-540.
Stauffer, J. M., & Mendoza, J. L. (2001). The proper sequence for correcting correlation coefficients for range restriction and unreliability. Psychometrika, 66(1), 63-68.
Help me keep the site updated, please. If you find someone's a site worth linking to or find that a link isn't working, put a message in the comments field. Your post will not be published if you refuse to publish it.
Edit
16.9.2021 135 min/990 min
13.9.2021 210 min/855 min
10.9.2021 420 min/645 min
9.9.2021 185 min/225 min
6.9.2021 40 min
Comments